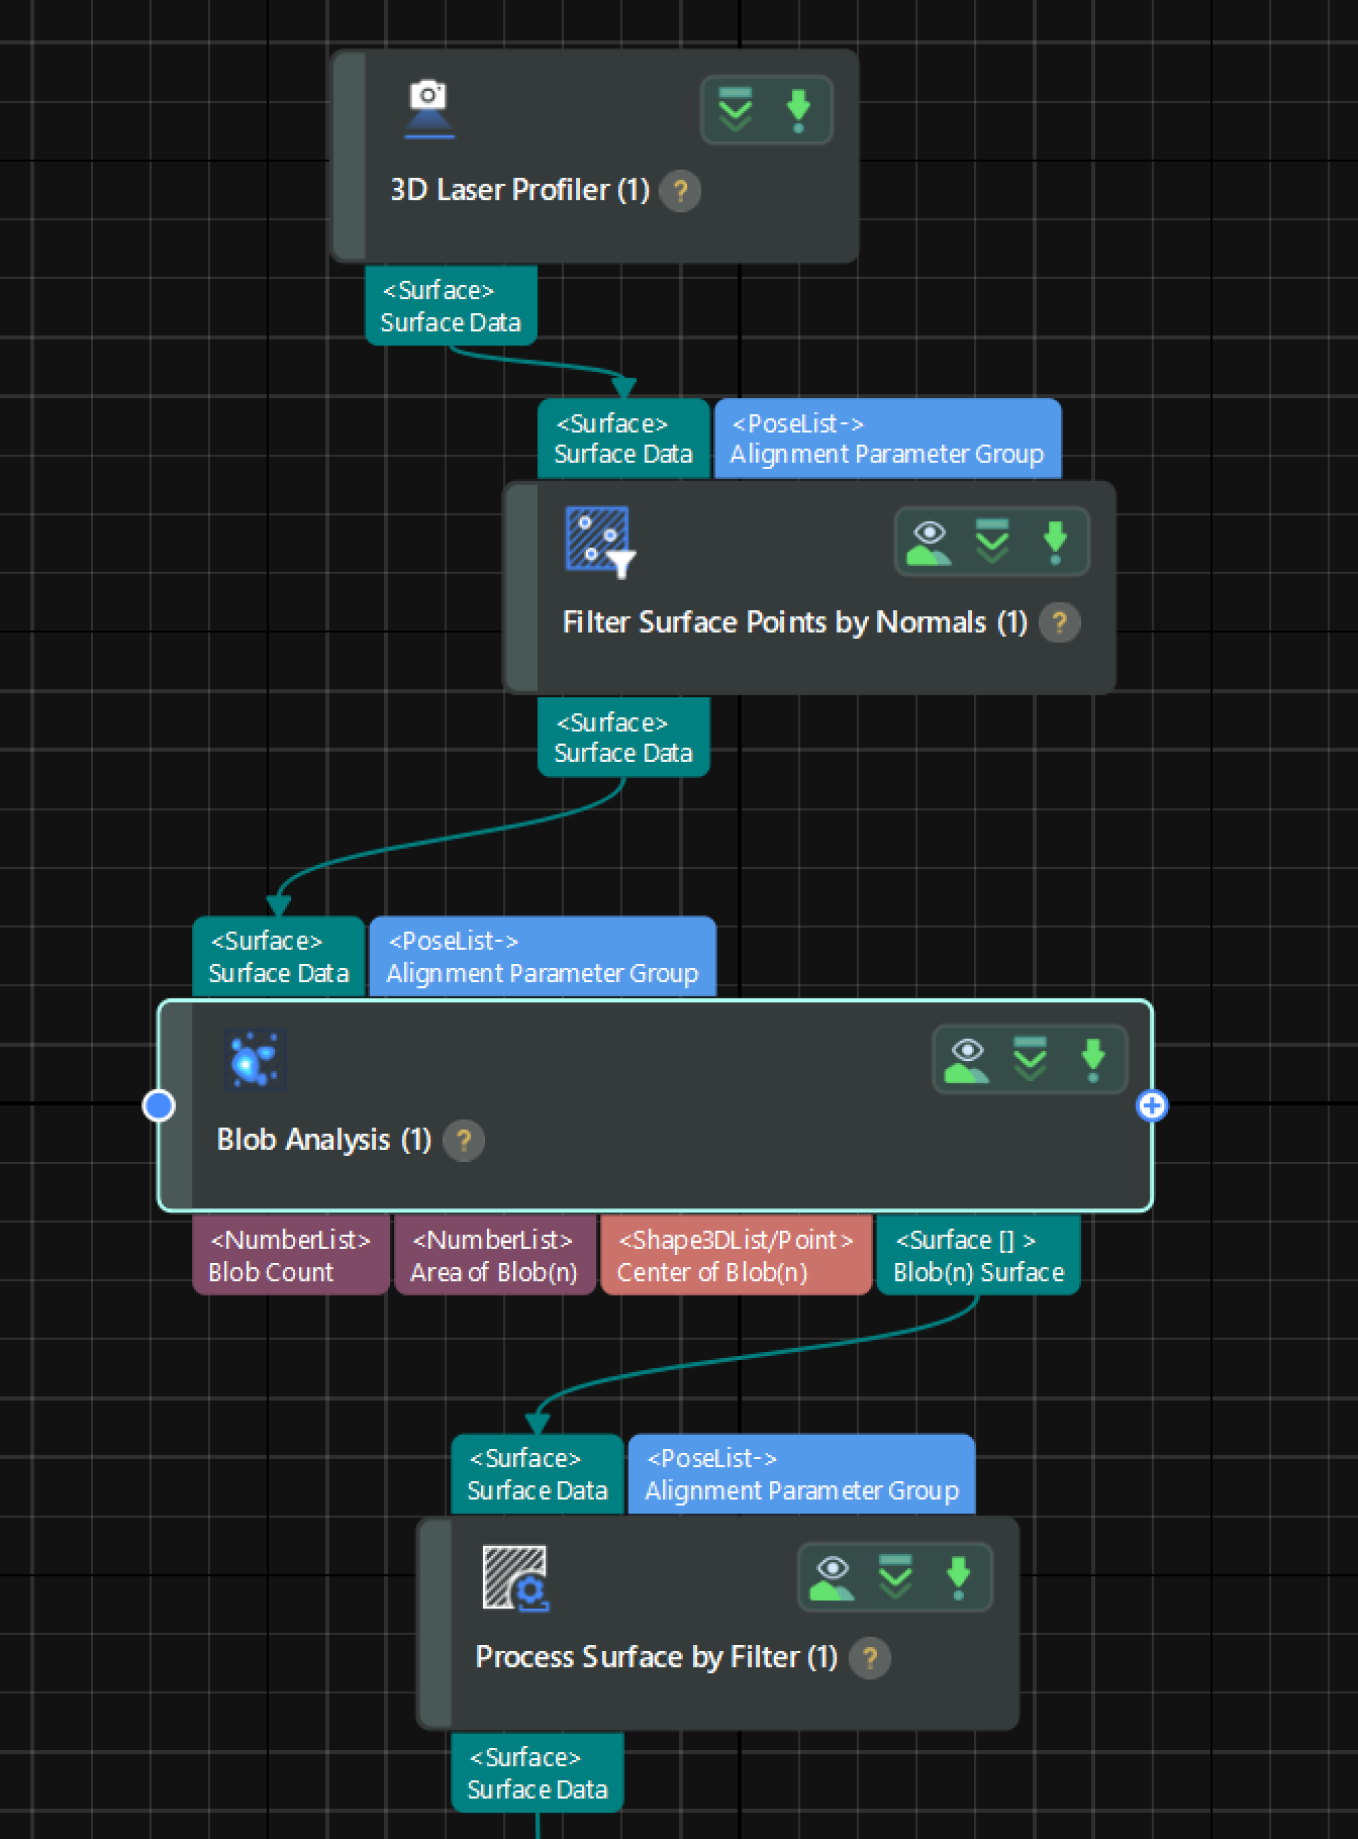
Data Processing
The obtained surface data of objects may vary in position, and it contains irrelevant data and noise. To increase the stability and accuracy of data, you can align, filter, and denoise the surface data before measurement.
Preprocessing workflow: Alignment ➡ Filtering ➡ Rough locating ➡ Filtering again
I) Alignment
During different scans of target objects, the object position in the acquired image data may vary slightly. You can extract common features to align different images and ensure consistency in subsequent measurements.
Follow the instructions on the Alignment Step below:
-
Create a model for matching: Click the Edit Model button to open the 2D model editor and select representative and common features to create a model.
For usage instructions, see 2D Model Editor. -
Set Step parameters: After selecting the model, adjust the other parameters in the Parameters section of the Step. In most cases, the default settings for these parameters should be sufficient. Under Output, verify that the Surface Data item is selected.
-
Output aligned data: After the Step is run, it will output the aligned image data.
- Tuning experience
-
-
The 2D matching model is crucial to image alignment. When creating a model, you should select the edges with stable point cloud quality and low feature similarity and that can effectively determine the X or Y direction of images as features.
-
To shorten the cycle time of measurement, you can appropriately narrow the angle range and scale range in the “Feature parameters” panel on the right side of the 2D model editor interface. For example, if the angle deviation of the incoming target objects in images does not exceed 5°, the angle range can be set to ±5° to speed up feature matching. For more parameter details, see Feature Parameters.
-
If it is difficult to select appropriate features, you can drag the Depth range setting sliders on the right side of the image to highlight edge features for easier feature selection.
-
2) Filtering
Use the Filter Surface Points by Normals Step to extract pin data from the aligned surface data and then perform data filtering to remove noise.
-
Use a feature region to select the pin data.

-
In the parameter configuration panel of the Step, adjust parameters to remove noise.
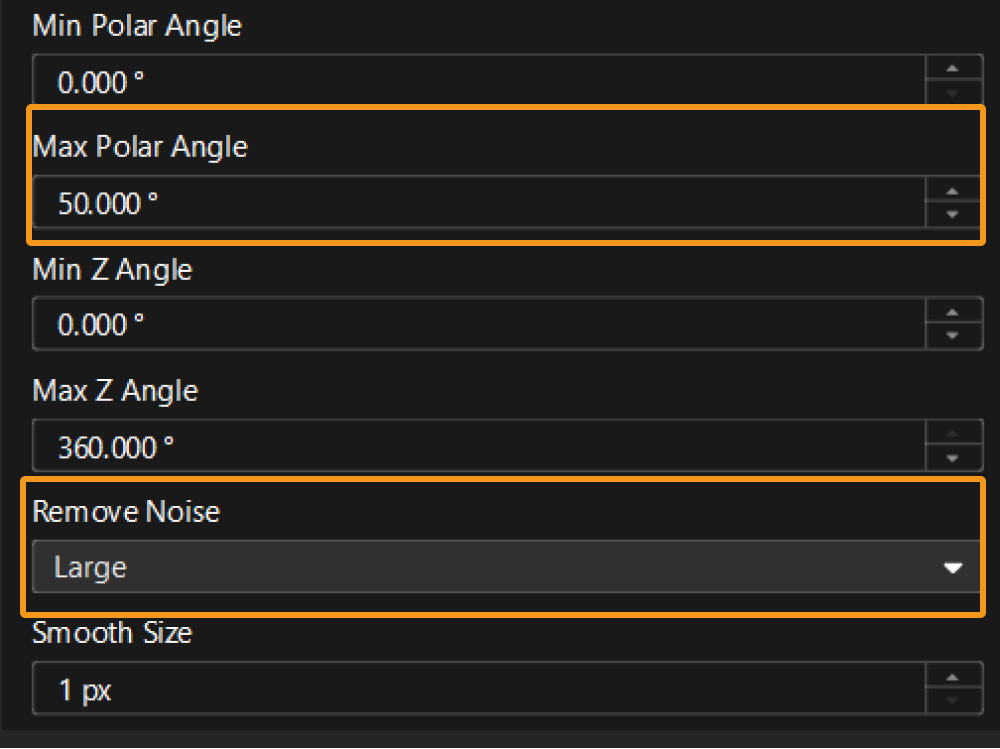
After the Step is run, it will output the processed surface data:
- Tuning experience
-
-
The Filter Surface Points by Normals Step is very effective in removing noise, especially for obtaining flat surface data. When the noise is slanted or consists of irregular scattered points, this Step can achieve good denoising results.
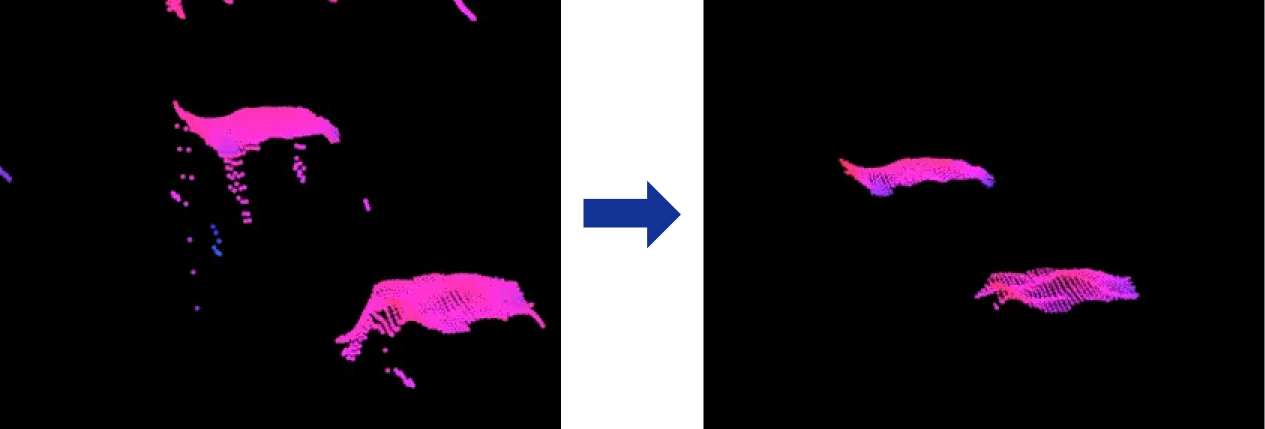
-
You can adjust the Max Polar Angle parameter to filter out slanted noise of varying degrees (recommended value: 60°) and adjust the Remove Noise parameter to filter out irregular points of varying degrees. Adjusting both parameters can produce better results. For more information on the parameters, see Angle-Based Filtering.
-
3) Rough Locating
Use the Blob Analysis Step to roughly locate pin tips from the filtered surface data.
-
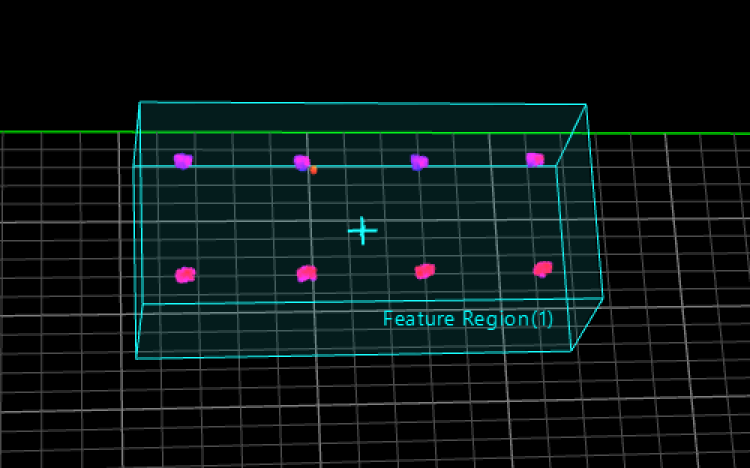
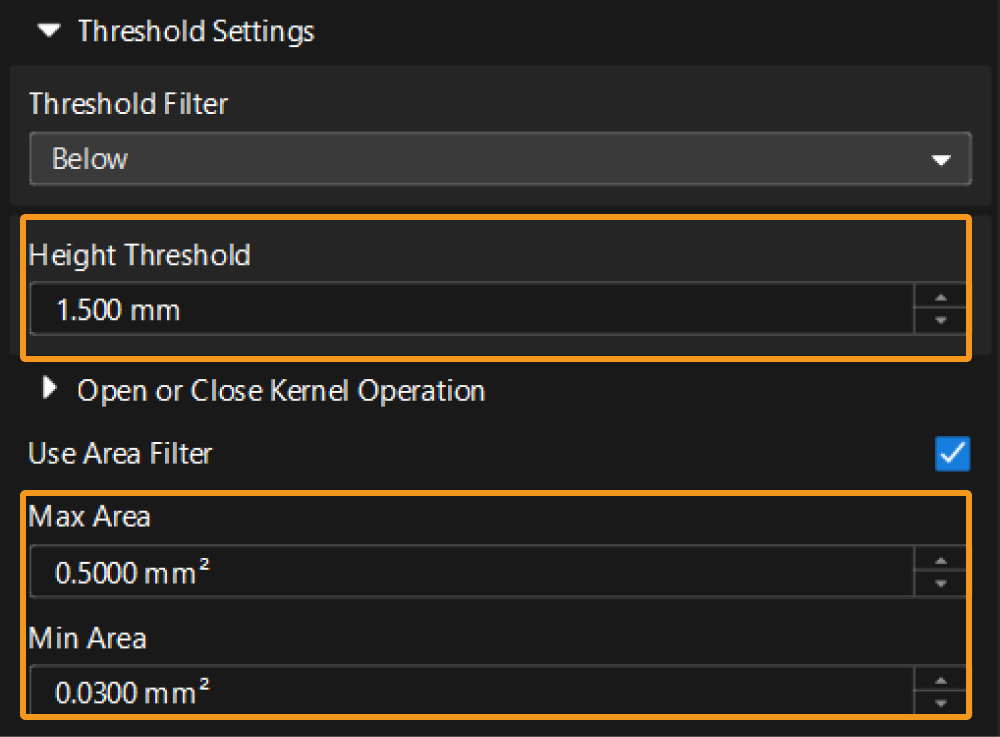
In the parameter configuration panel of the Step, set appropriate height thresholds and area thresholds to detect the surface data of pin tips, i.e., multiple blobs.
-
Set the blob ordering method to number the detected blobs so that each blob can be accurately located in subsequent processes.
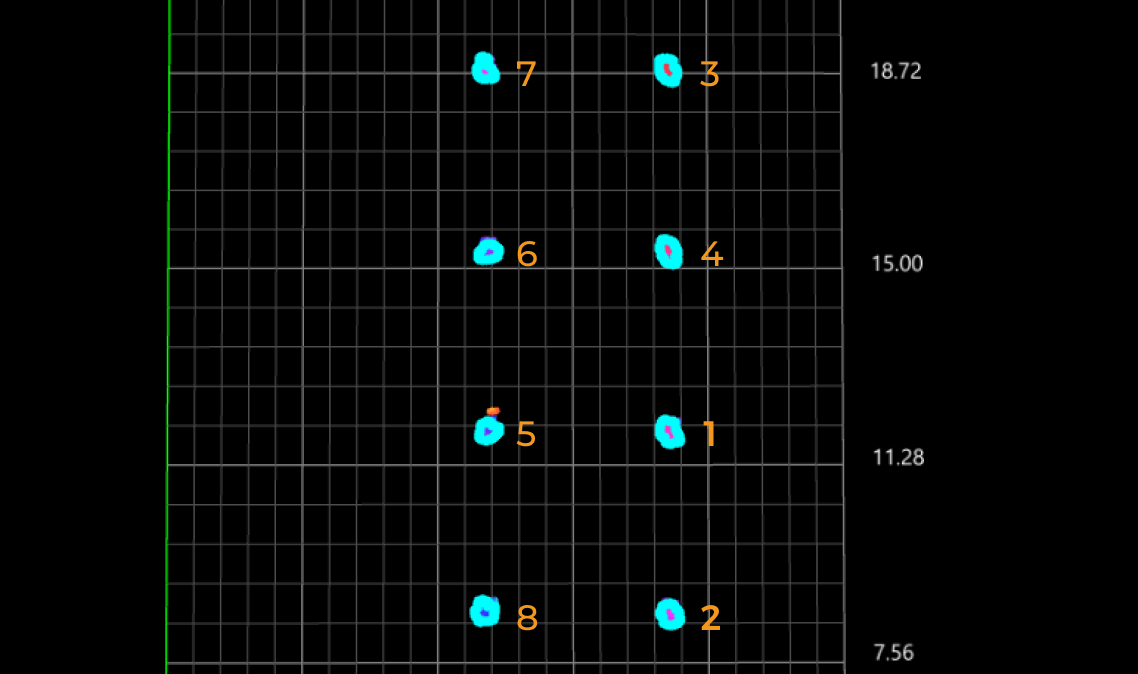
As shown in the figure, blobs are ordered by “Position (X decreasing).” The blob numbers (index) are for reference only.
Order blobs according to the actual needs. - Tuning experience
-
-
The Blob Analysis Step is essential for locating and outputting the surface data of each pin tip. In most cases, you can obtain good surface data of pin tips by setting reasonable height thresholds and area thresholds.
-
If data adhesion occurs, you can address the issue in the previous filtering process.
-
4) Filtering Again
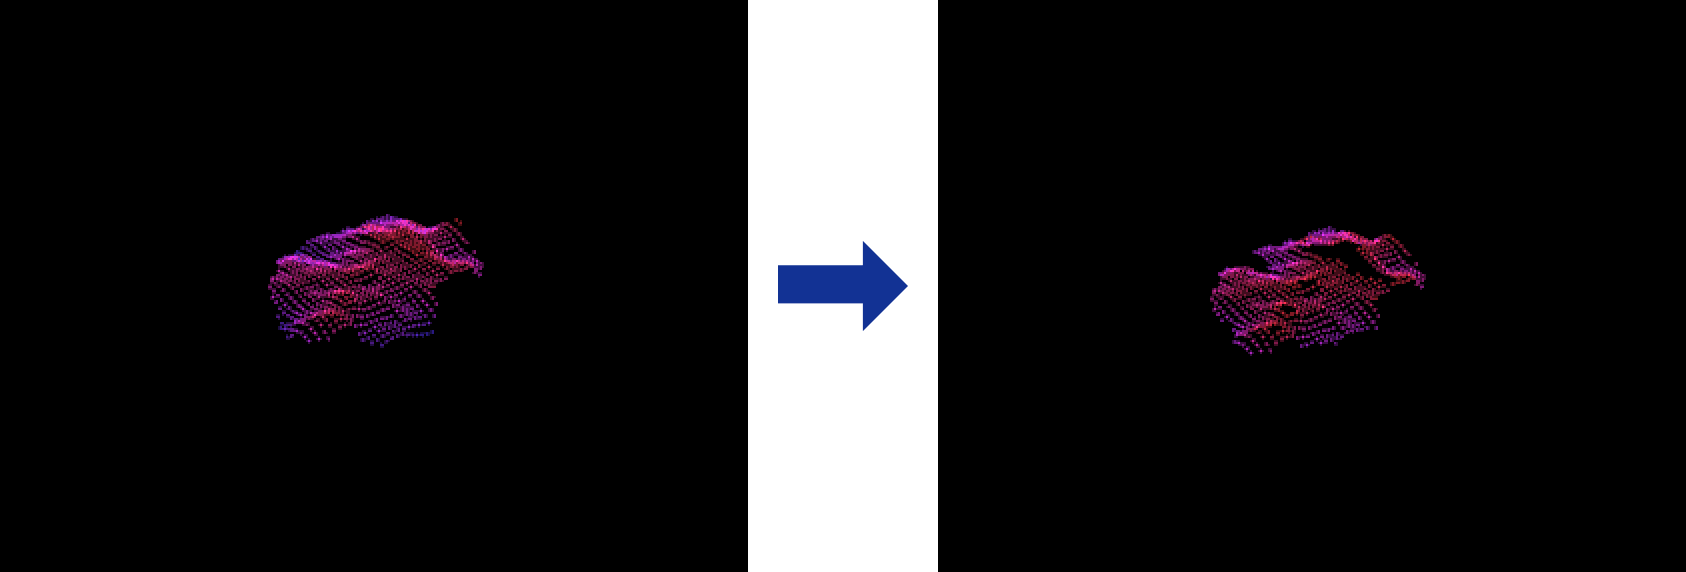
Use the Process Surface by Filter Step to filter the surface data of pin tips obtained from rough locating by removing the highest and lowest points in the data to effectively reduce data fluctuations.
Select the filter type of Percentile, and set the low and high thresholds of percentiles, respectively, to 10% and 90%.
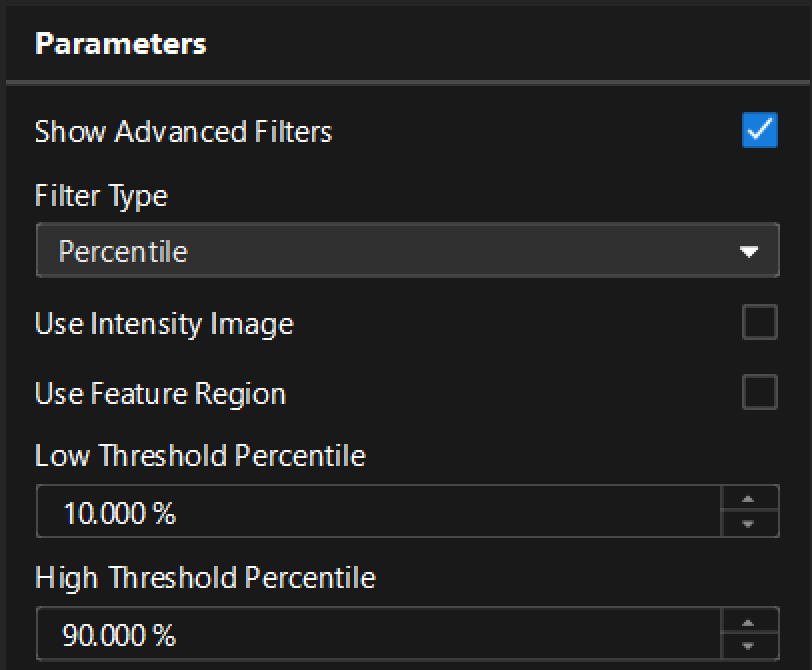
Then, run the Step to obtain the filtered surface data.
Next, you can start to measure the height of pins.