Measure Surface Deviation
Description
Use this Step to calculate deviations between surface data and the 3D model.
| Before running the step, please ensure that 3D model files (in STL or PLY format) and model pose files in JSON format are prepared. Otherwise, the Step cannot be run successfully. |
Workflow
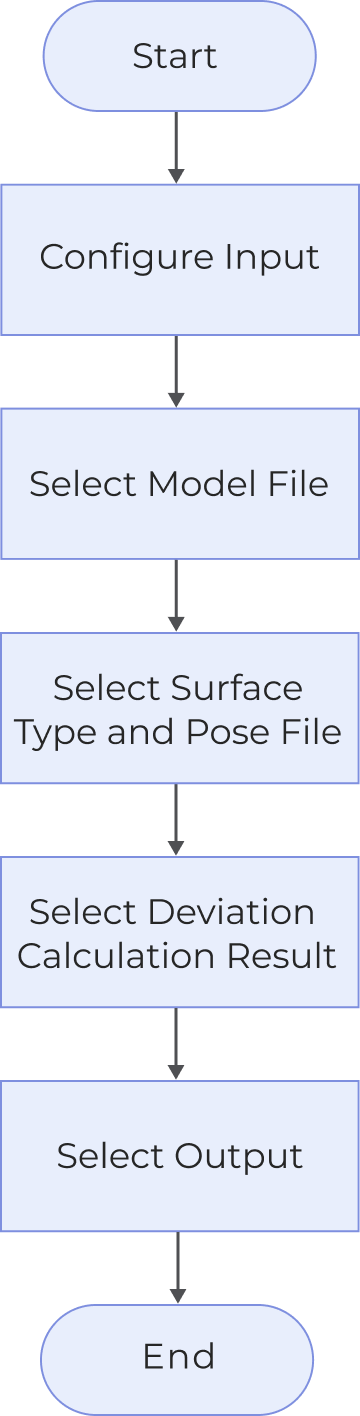
The process of configuring this Step is shown below:
-
Configure the input. Connect the ports manually in the graphical programming workspace or select the input under Input in the parameter configuration panel.
-
Select proper model file format and model file path.
-
Select model surface type and model pose JSON file path.
-
Select the deviation calculation result.
-
Select the Output item under the Output tab.
Parameters
| Parameter | Description | ||
|---|---|---|---|
Model File Format |
You can select the format of 3D model files to be loaded, and only STL and PLY formats are supported. |
||
Model File Path |
The path of 3D model files. |
||
Model Surface Type |
You can select the model’s top or bottom surface as the reference surface for deviation calculation. |
||
Model Units |
Units used by the model. Value list: millimeters, meters |
||
Model Pose JSON File Path |
The pose of model surface data is stored in JSON files. |
||
Deviation Calculation Result |
Select deviation calculation and statistical results stored in Deviation Viewer to calculate the feature point and deviation of output items.
|
Output Description
Select the output item(s) to add the output port(s) to the Step, and the corresponding data will be output after the Step is run. You can select the output according to the actual measurement requirements.
|
If you select an expandable output item (with a ▶ on the left), you should expand it by clicking ▶, and then set the Min and Max values to determine the acceptable range. If the output value falls within the acceptable range, the measurement item is judged as passing (OK), or else it is judged as failing (NG). |
| Output item | Description |
|---|---|
Surface data |
The surface data obtained after comparing the surface data with the model, and the Z value represents the deviation. |
Feature Points |
The centers of the circles in each drawn area in the “Deviation Viewer”. |
Deviation |
The mean of the deviations in each drawn area in the “Deviation Viewer”. |
Troubleshooting
|
CV-W4101
Error: The number of points in the PLY file must be greater than or equal to 3.
Solution: Please check the file and make sure the number of points in PLY file is greater than or equal to 3.
CV-W4102
Error: The number of points must be equal to the number of normals in the PLY file.
Solution: please check the file and make sure the number of points is equal to the number of normals in the PLY file.
CV-W4103
Error: The magnitude of normals must be equal to 1 in the PLY file.
Solution: Please check the file and make sure the magnitude of normals in PLY file is equal to 1.
CV-W4104
Error: The PLY file contains invalid point(s) (NaN values).
Solution: Please check the file and make sure the PLY file contains no invalid point.