Data Viewer
Data Viewer can be used to display the acquired data, adjust feature regions, and view the data processed by each Step, such as profile, planes, feature points, and distance.
| You can use Data Viewer only after Debug Output is enabled in the graphical programming workspace. |
The following figure shows the interface of the data viewer. The usage of each feature is introduced below.
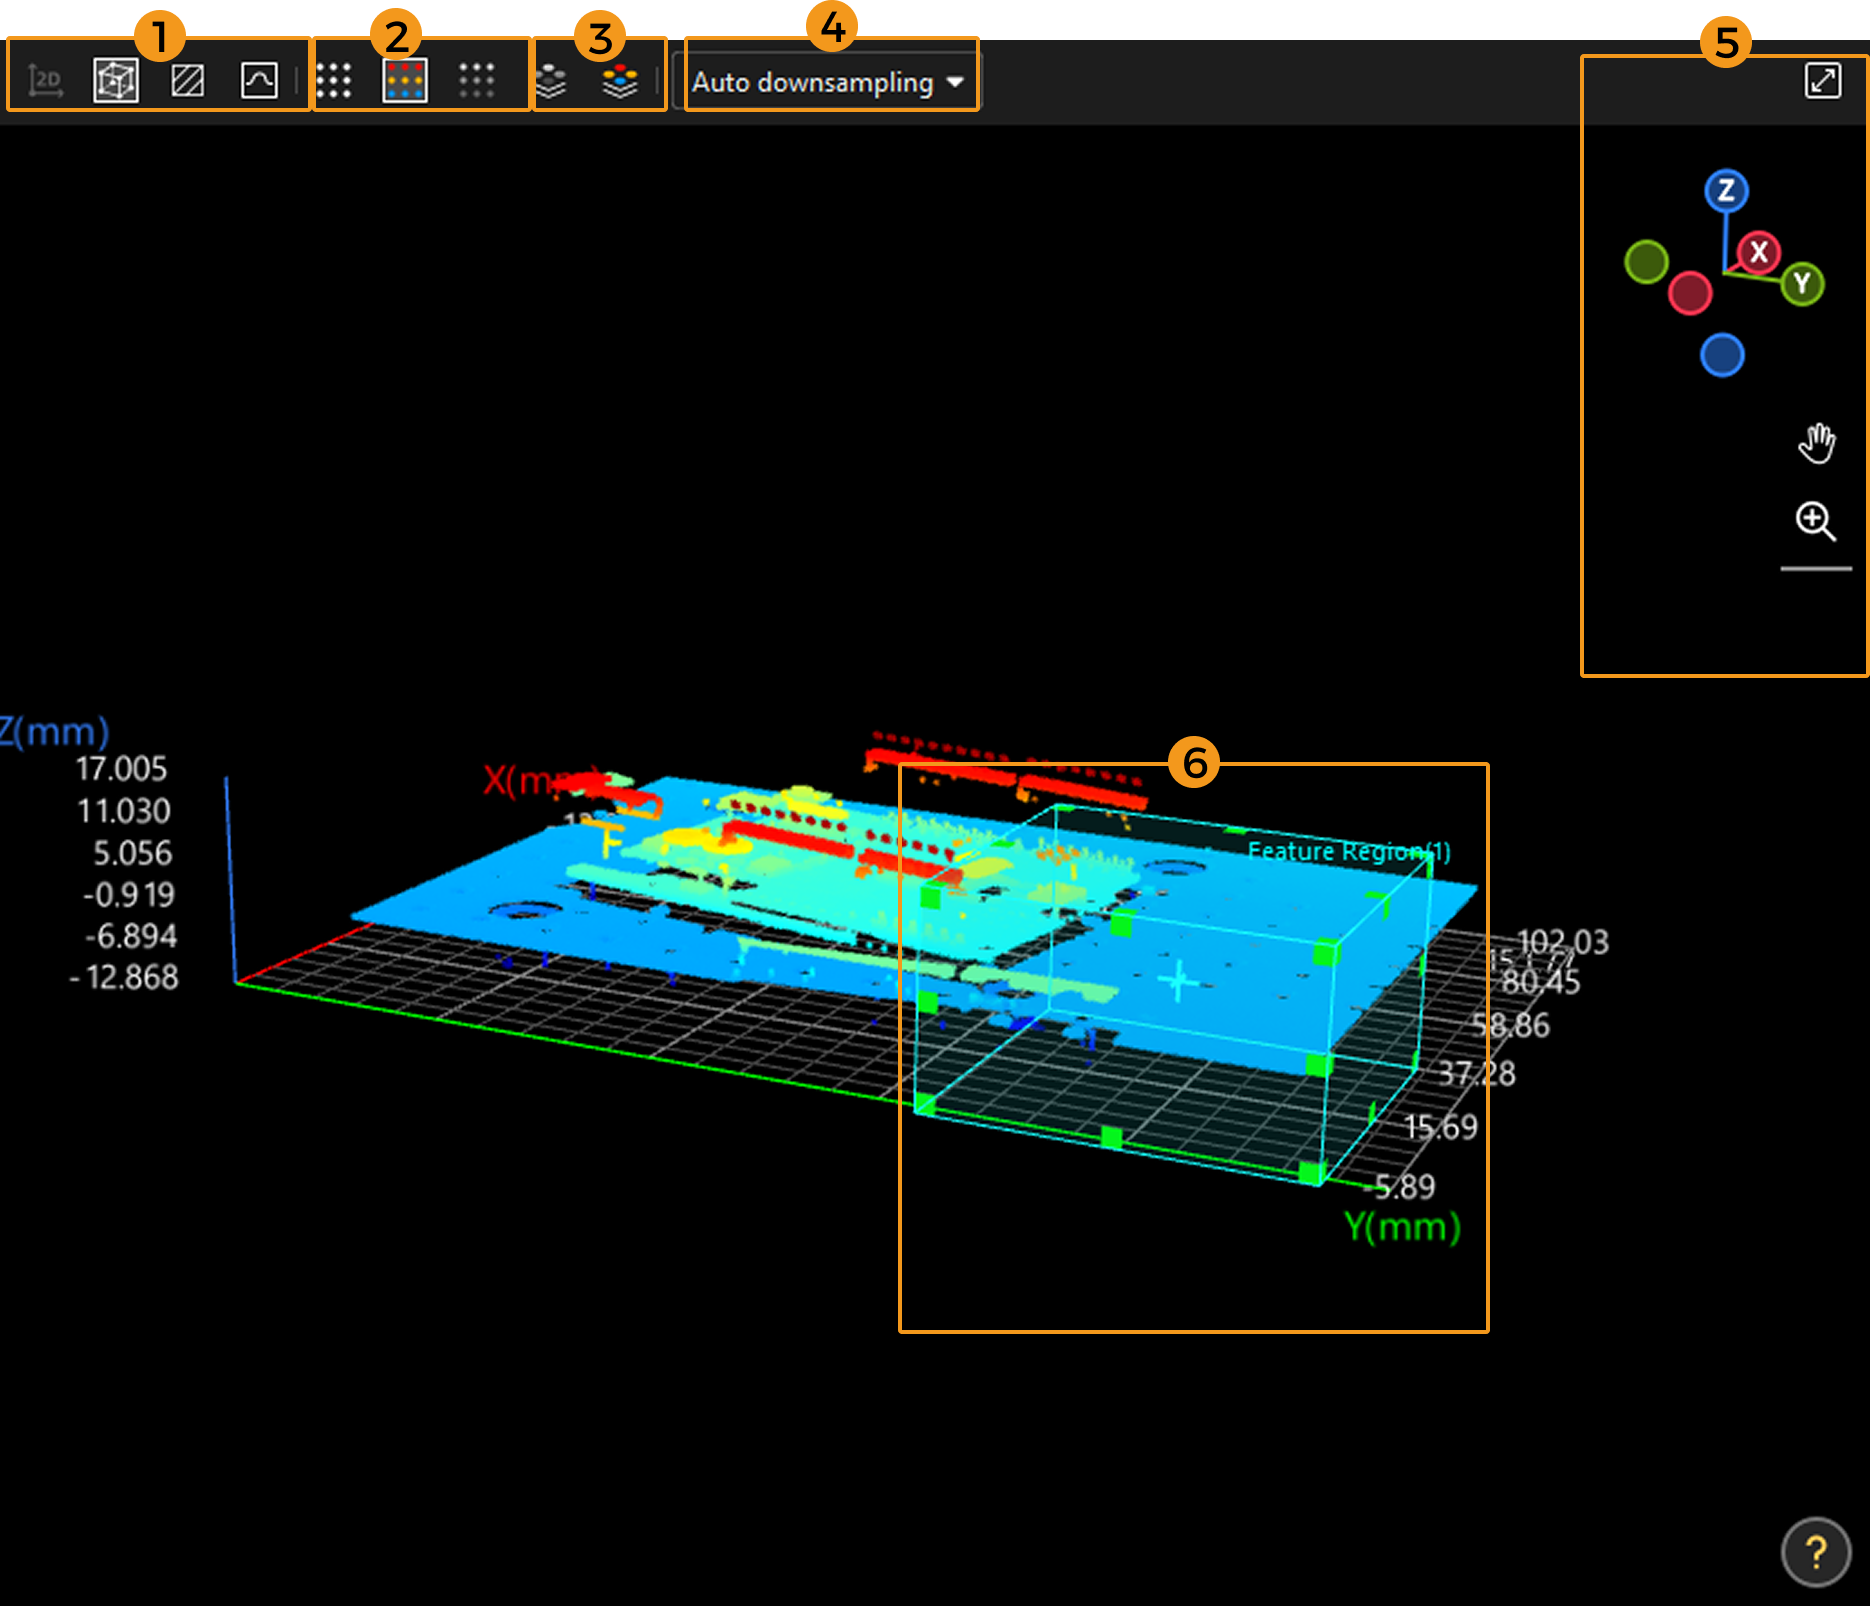
Switch the Display Mode (①)
Use the following icons to switch the display mode:
-
Click
 to switch to the Image 2D mode and view the data in a 2D perspective. Only available when there are 2D images.
 -
Click
 to switch to the Perspective mode and view the data in a 3D perspective.
 -
Click
 to switch to the Surface mode and view the data on the XOY plane.
 -
Click
 to switch to the Profile mode and view the data on the XOZ plane. Profiles are usually processed in this view.
Switch the Point Cloud Mode (②)
Use the following icons to switch the point cloud mode:
-
Click
 to switch to the Monochrome point cloud.
 -
Click
 to switch to the Color point cloud.
 -
Click
 to switch to the Grayscale point cloud.
Switch the Intensity Image Mode (③)
Use the following icons to switch the intensity image mode:
-
Click
 to switch to the Intensity image.
 -
Click
 to switch to the Color intensity image.
Downsampling Settings (④)
When the size of the image is large, the processing time of visualization data may be longer, and jamming may occur after Debug Output is enabled. You can reduce the image resolution by downsampling settings, thus reducing the amount of data and improving visualization processing efficiency.
-
Auto downsampling: Automatically select the optimal downsampling ratio based on the size of the image, balancing visualization efficiency with image details.
-
No downsampling: Keep the original image resolution and no downsampling.
-
Fixed ratio: Reduce the width and height of the image to the original 1/2, 1/4, 1/6, 1/8, 1/10, 1/12, 1/14, or 1/16, respectively. Selecting a smaller scale (such as 1/16) can speed up visualization, but more image details will be lost.
| The downsampling setting only affects the display and not the calculation result of the Step. |
|
If the visualization requirements are high, you can use an IPC with better performance to solve the stuck-on software execution issue after Debug Output is enabled. Mech-Mind IPC provides the standard operation environment for Mech-Mind’s software products and therefore can maximize the function and performance of the software. For a better user experience, please select the appropriate IPC according to the actual project requirements.
|
Adjust View (⑤)
Use the following buttons or shortcuts to adjust the view:
| Adjustment method | Instructions |
|---|---|
Rotate the view |
Press and hold the left mouse button and drag in any direction. |
Pan the view |
Press and hold |
Zoom in/out |
Press and hold |
Fit the view |
Click |
The navigation gizmo ![]() shows the orientation of the current view. Click the icon of each axis (X, Y, Z, -X, -Y, -Z) to align the view with the axis.
shows the orientation of the current view. Click the icon of each axis (X, Y, Z, -X, -Y, -Z) to align the view with the axis.
Set a Feature Region (⑥)
Feature regions define the target regions of algorithm processing. You can roughly and intuitively adjust the position and size of the feature region in the data viewer area.
For detailed instructions, see Adjust Feature Region in Data Viewer Area.