Perform SPC Analysis
This document describes how to perform SPC analysis in Mech-Metrics.
|
SPC stands for Statistical Process Control, which refers to the use of statistical methods to monitor each stage of the production process in order to ensure and improve product quality. |
The steps for performing SPC analysis are as follows:
-
In the upper-part ribbon, select .
-
Click SPC analysis in the upper-right corner of the Historical Data page.
-
The Overview tab of the SPC Analysis page will be displayed. On the Overview tab, you can view the following information:
-
Total number of measured features for the current part
-
Number of qualified features, number of unqualified features, pass rate, failure rate
-
Maximum value, minimum value, average value, deviation value
-
-
Click the Analysis tab. In the Sampling tool, set the sampling mode, sampling frequency, subgroup size, number of subgroups, and first sampled record as needed, then click Analyze.
-
If analysis cannot be performed, troubleshoot the issue based on the error message provided by the software.
-
-
On the Analysis tab, you can view the following information:
-
USL and LSL
-
The Upper Specification Limit, abbreviated as USL, is the upper limit of a dimension, which is the nominal value plus the upper tolerance. For example, if the nominal length of a feature is 5mm and the tolerance is -1 to 1mm, the USL would be 6mm.
-
The Lower Specification Limit, abbreviated as LSL, is the lower limit of a dimension, which is the nominal value plus the lower tolerance. For example, if the nominal length of a feature is 5mm and the tolerance is -1 to 1mm, the LSL would be 4mm.
-
-
3σ, UCL, LCL, CL, and control charts
-
σ represents the standard deviation. The 3σ rule, also known as the three-sigma rule, is a method used in statistics to exclude outliers. It assumes that the data follows a normal distribution, and any data point that exceeds the mean plus or minus three standard deviations is considered an outlier and should be removed from the dataset. The 3σ control limits are used to check whether data points lie within three standard deviations of the mean.
-
The Central Line, abbreviated as CL, is a line consisting of the average values (
 ).
). -
The Upper Control Limit, abbreviated as UCL, is the value obtained by adding 3σ to the average value.
-
The Lower Control Limit, abbreviated as LCL, is the value obtained by subtracting 3σ from the average value.
-
A control chart, is used to analyze and determine whether a process is in a state of control. It includes control limits. The control chart is based on the 3σ rule in normal distribution, where the central line represents the average value (
), and the upper and lower control limits are calculated by adding and subtracting 3σ from the average value. These limits are used to identify if there are any issues occurring in the process.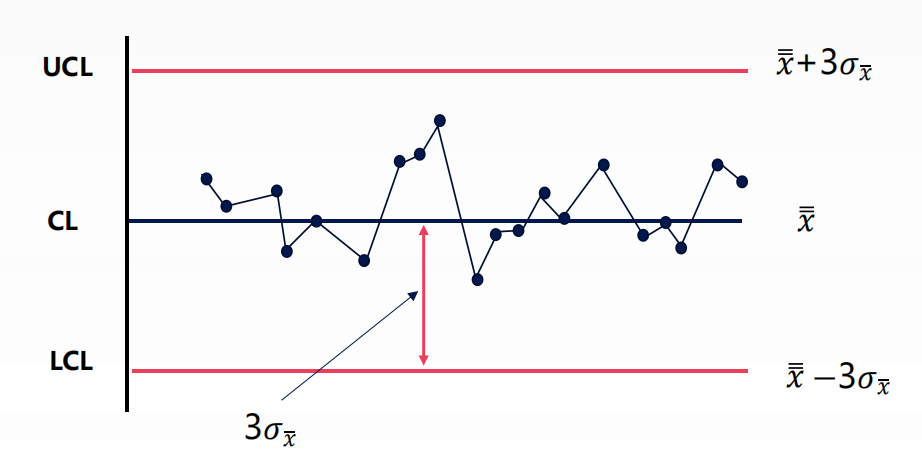
-
-
Pp and Ppk
-
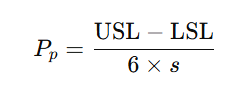
The Process Performance, abbreviated as Pp, is used to assess whether the performance of a process meets specification requirements. The formula for calculating Pp is as follows, where s represents the sample standard deviation.
-
The Process Performance Index, abbreviated as Ppk, is used to assess whether the performance of a process meets specification requirements. Compared to Pp, Ppk takes into account the impact of the process performance mean. The formula for calculating Ppk is as follows, where
represents the sample mean and s represents the sample standard deviation.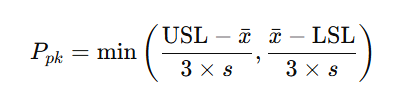
-
-
Cp and Cpk
-
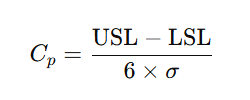
The Process Capability Index, abbreviated as Cp, is used to assess whether the capability of a process meets specification requirements. The formula for calculating Cp is as follows, where σ represents the population standard deviation.
-
The Process Capability Index, abbreviated as Cpk, is used to evaluate whether the capability of a process meets specification requirements. Unlike Cp, Cpk takes into account the effect of the process mean. The formula for calculating Cpk is as follows, where
represents the population mean and σ represents the population standard deviation.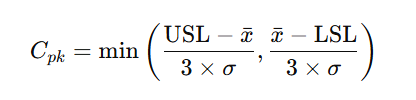
-
-
-
After the analysis, you can click Export current or Export all on the Analysis tab to export analysis reports for future use.
-
The Export current button exports the analysis report for the current sub-item.
-
The Export all button exports the analysis report for all sub-items.
-