User Interface
Welcome Screen
After you install and open Mech-Metrics, the welcome screen will appear, as shown in the following figure.
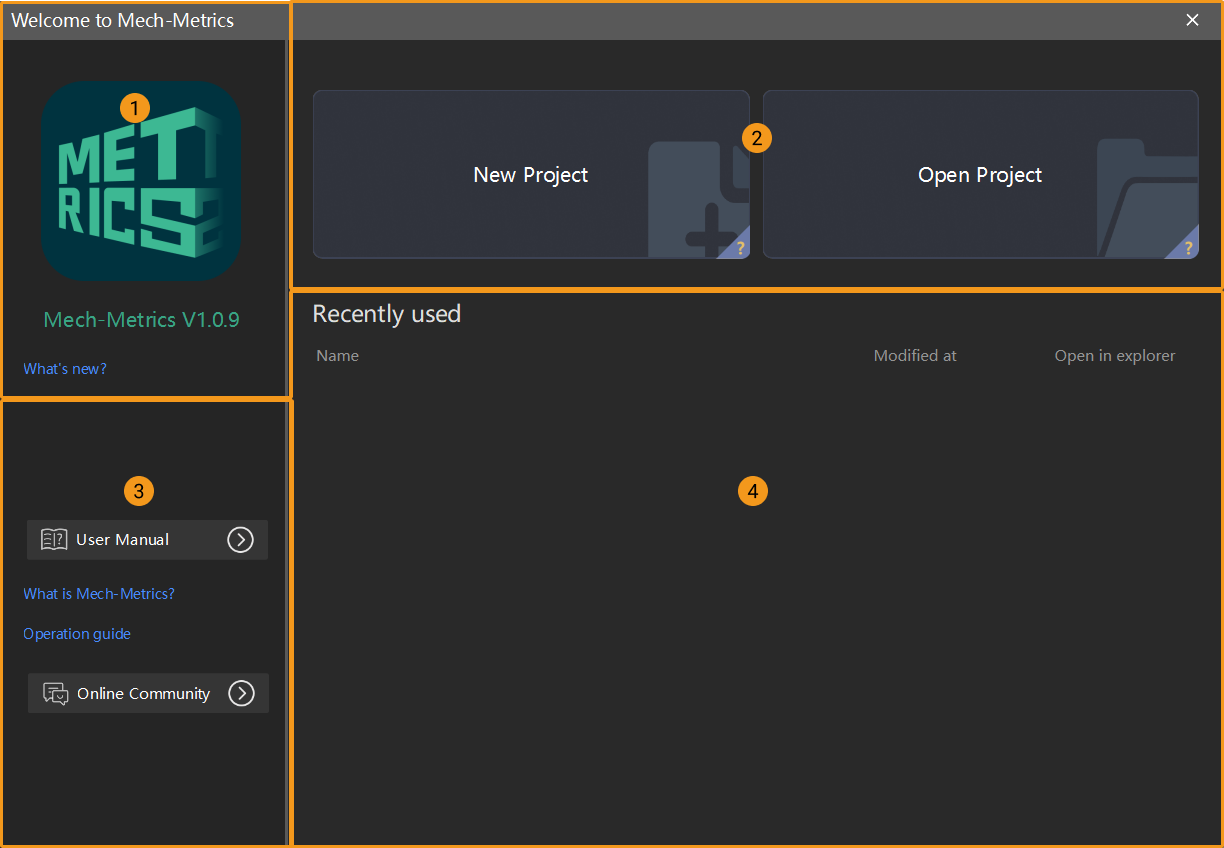
The welcome screen consists of the following sections.
| No. | Section | Description |
|---|---|---|
① |
Version information |
Check version information and release notes. |
② |
Quick entry |
Create a project or open an existing project. You can hover the cursor over the “?” icon in the lower-right corner of the card to check the description. |
③ |
User manual and online community |
You can browse Mech-Metrics’s user manual or access the online community for questions and discussions by clicking the relevant buttons. |
④ |
Recently used |
Open a recently used project. |
Main Interface
After you create a project in the welcome screen of Mech-Metrics, you will enter the main interface. The main interface consists of the following sections from top to bottom:
-
Menu bar
-
Configuration interface
-
Production interface
-
Logs panel
A detailed introduction to each section is described below.
Menu bar
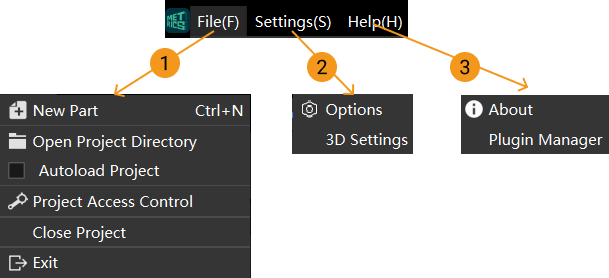
The menu bar appears on both the configuration interface and the production interface. In the menu bar, you can modify general project and software settings.
The following figure shows the menu bar.
Thy following table describes frequently-used buttons of the menu bar.
| No. | Button | Description |
|---|---|---|
① |
File |
Under the File button, you can perform the following operations:
|
② |
Settings |
Under the Settings button, you can perform the following operations:
|
③ |
Help |
Under the Help button, you can perform the following operations:
|
Configuration Interface
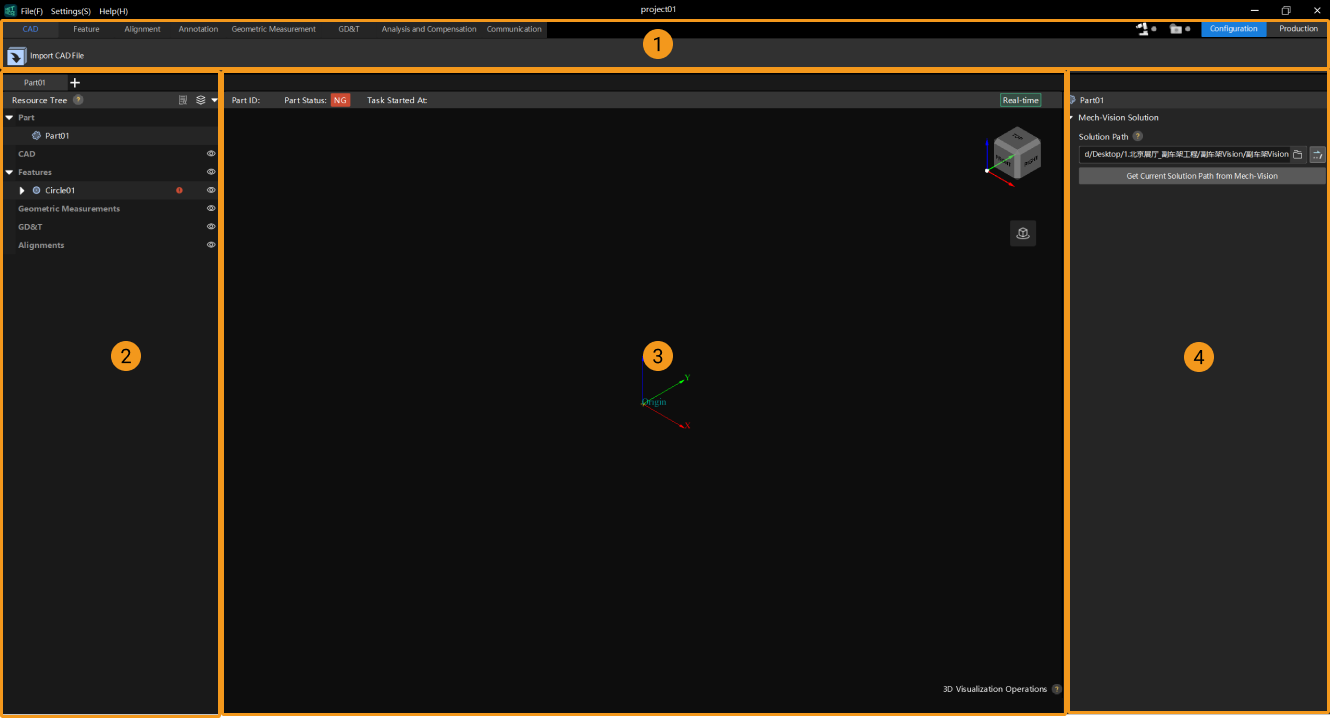
In the configuration interface, you can add measurement items and configure measurement parameter for the items. The following figure shows the configuration interface.
The following table describes frequently-used features of the configuration interface.
| No. | Section | Description |
|---|---|---|
① |
Ribbon |
The upper-part ribbon shows main features of this software. In this section, you can perform the following operations:
For more information, see Chapter 1: Measurement Project Configuration. |
② |
Resource Tree |
The left-side resource tree displays all resources of the current part, including the CAD model of the part, and the features, annotations, alignments, geometric measurements, and GD&T measurements created for the part. You can also show or hide resources in the resource tree. The steps for show and hide operations are as follows:
|
③ |
3D View |
The central 3D view section displays the imported CAD model of the current part, along with the created reference frames, features, annotations, distances, and other information in the 3D format. You can also perform pick features in the 3D view. For more information, see Configure Nominal Values for the Feature. |
④ |
Parameter Panel |
Click any resource in the resource tree on the left, and its related information will be displayed in the parameter panel on the right, including nominal values, measured values, tolerances, and more. You can edit and modify certain information in the parameter panel. |


Production Interface
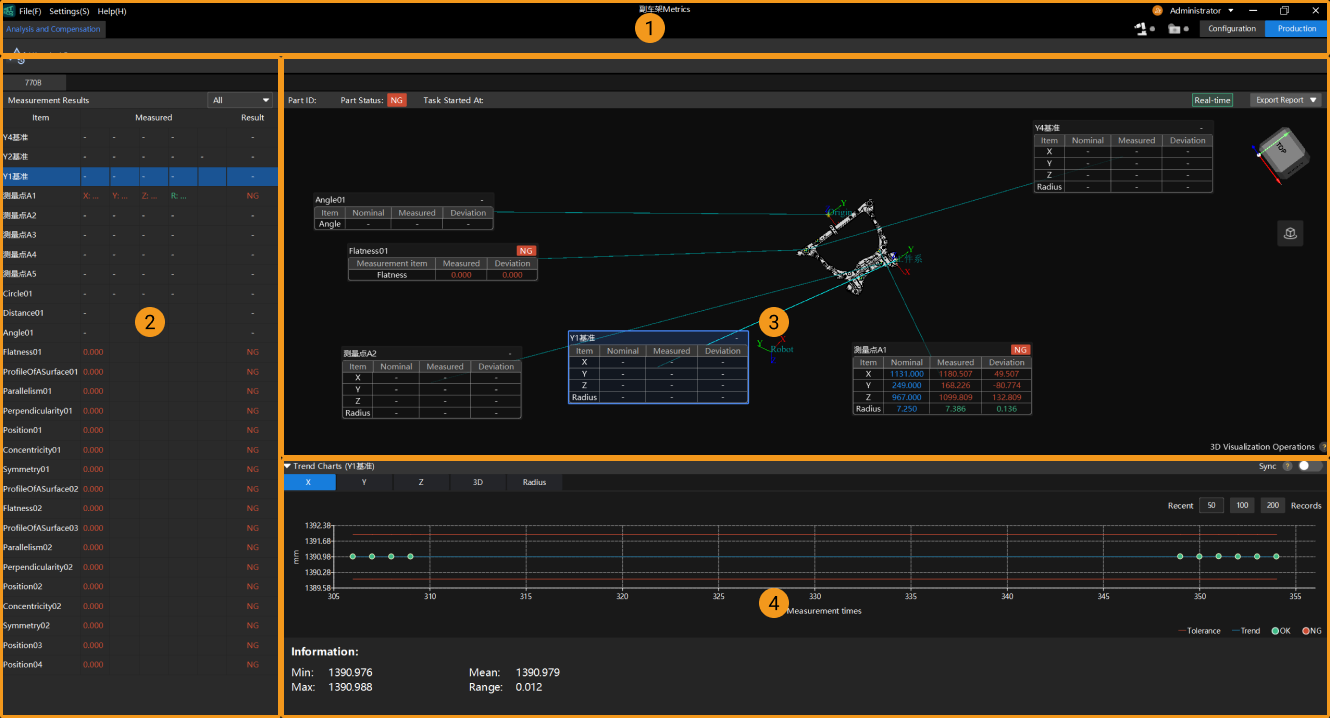
In the production interface, you can view and analyze detailed part data, but cannot add measurement items or configure measurement parameters. The production interface is shown in the figure below.
The following table describes frequently-used features of the production interface. For more information, see Use Production Interface.
| No. | Section | Description |
|---|---|---|
① |
Ribbon |
In this section, you can perform the following operations: Analysis and Compensation: View, filter, and export historical data. |
② |
Measurement Results |
In this section, you can view the measurement results of features, including the measured values and judgment results. |
③ |
3D View |
In this section, you can view the created CAD model of the part, features, annotations, reference frames, distances, and more. Real-time measurement results will also be displayed in this view. |
④ |
Trend Charts |
In this section, you can check the change trends of measurement data as the number of measurements increases. |
Logs Panel
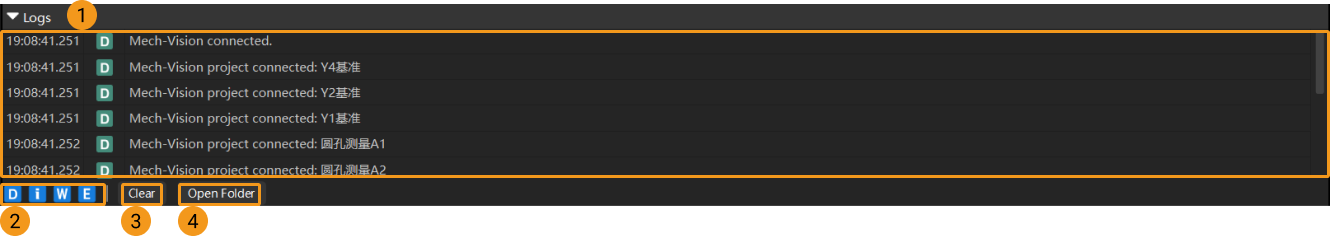
The logs panel is located at the bottom of the software, as shown in the figure below. It is used to record and notify you of important operations performed within the software. For example, after you open a project, the logs panel will display Current project: xxx. If the you modify a setting, the logs panel will display xxx modified. If you perform an improper operation, you can check the logs displayed in the logs panel for troubleshooting.
| No. | Button/Section | Description |
|---|---|---|
① |
Logs Panel |
The logs panel records all log information from when you open the project to the execution of the current operation. |
② |
D i W E |
The four D i W E buttons are used to filter logs. The meaning of each button is as follows:
When you click any of these buttons, logs of that type will no longer be displayed. For example, after clicking the D button, debug logs will no longer appear in the logs panel. For troubleshooting, you can click D, i, and W sequentially. Then, only error logs will be displayed in the logs panel to help you troubleshoot the issue. |
③ |
Clear |
Click Clear will clear all displayed logs in the logs panel. |
④ |
Open Folder |
Clicking Open Folder will allow you to view logs from the past several days. Daily logs are stored in separate log files named by date. You can select in the top menu bar to view the log expiration time to check the current log retention period. You can also modify the log retention period as needed. In case of an error, you can check the logs for the current day to troubleshoot the issue. |